POW #1 President's Inauguration Problem
Summary
This problem focuses on a satellite image of Washington D.C. during the inauguration of Barack Obama. Our task was to estimate how many people attended this event.
This problem focuses on a satellite image of Washington D.C. during the inauguration of Barack Obama. Our task was to estimate how many people attended this event.
_______________________________________________
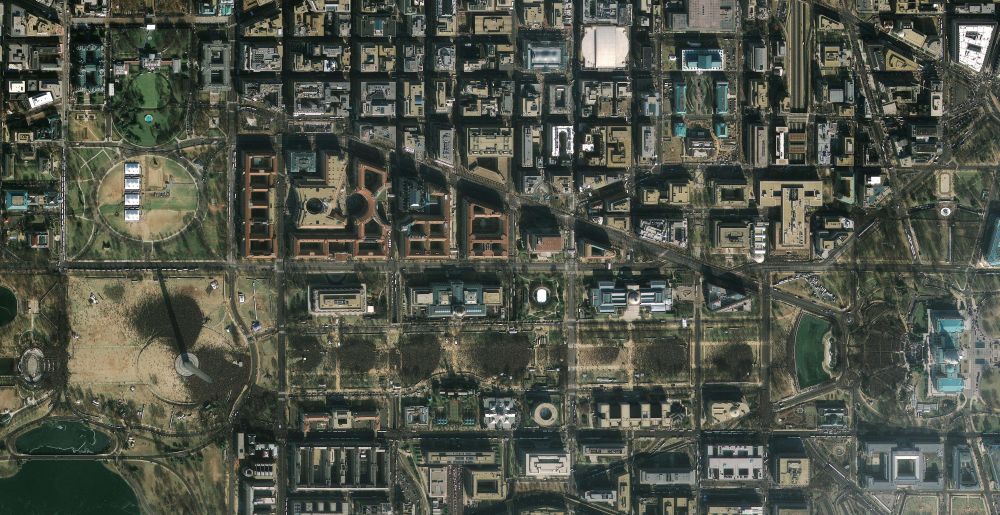
Satellite Image of Washington D.C. during the Inauguration
Problem Write-Up
Problem Statement
In this assignment, my group and I needed to solve the problem of how many people were at the President’s Inauguration by using a satellite image to find an estimate. This picture showed the National Mall from the Capital to the Washington Monument with large groups of people situated around the area. To solve this problem, our group of 4 used rulers, calculators, and a dry erase marker. We could use any method to find answers to this and there was no wrong answer since this is an estimate.
Process
The first thing that our group did was scale the picture to the actual measurements of that area. Looking it up on a website, we found that the distance from the Capitol building to the Washington Monument was 1.2 miles. Then, we used a ruler to measure that same distance on the picture using centimeters. We found that distance to be 28 centimeters. Using both these measurements, our group scaled down the ratio by dividing by 2. After find the scale of the picture, we needed to find a way to easily calculate the entire area. After some consideration, our group decided on splitting up the area in sections that we can calculate. With a ruler and a dry erase marker, we marked out each section on the photo and named them A through G, A being in front of the Capitol building and G being the Washington Monument. Then we measured out the length and width of each one. Before finding the area of each one and calculating the area, we needed to find how much space one person took up standing up and sitting down. We needed find how much space one person took up sitting down because the front area, A, was a sitting area. Two of our group members decided to take measurements of each one. One person measured while the other one simulated a by-stander in each test. After finding these measurements, we multiplied the length and width of each section as well as one person sitting or standing to get the area. Finally, by dividing Area A by the area of one person sitting and dividing the rest of the areas by the area of one person standing, then adding the total up, we found our solution to how many people there were.
Solution
In the end, our group had found that the estimated amount of people at the Inauguration was 5,317,092. From the data, we concluded that in Area A, there was an estimate of 140,285 people, in Area B, there was an estimate of 546,604 people, in Area C, there was an estimate of 925,881 people, in Area D, there was an estimate of 338,640 people, in Area E, there was an estimate of 1,094,006, in Area F, there was an estimate of 756,960 people, and in Area G, there was an estimate of 1,514,716 people, adding up to the main total.
Reflection
Even though my group and I had completed the problem, I felt that the answer was way off. Looking at the problem, I believed that we had actually created an estimate of the maximum amount of people that the area can fit. Instead of including all of the gaps that no one filled, we calculated the entire area that we saw people in. If I were to do this problem differently, I would take the groups of people and calculate the area that they take up instead of the entire block that they are stationed in. I would also search the map for any groups of people we missed.
Data
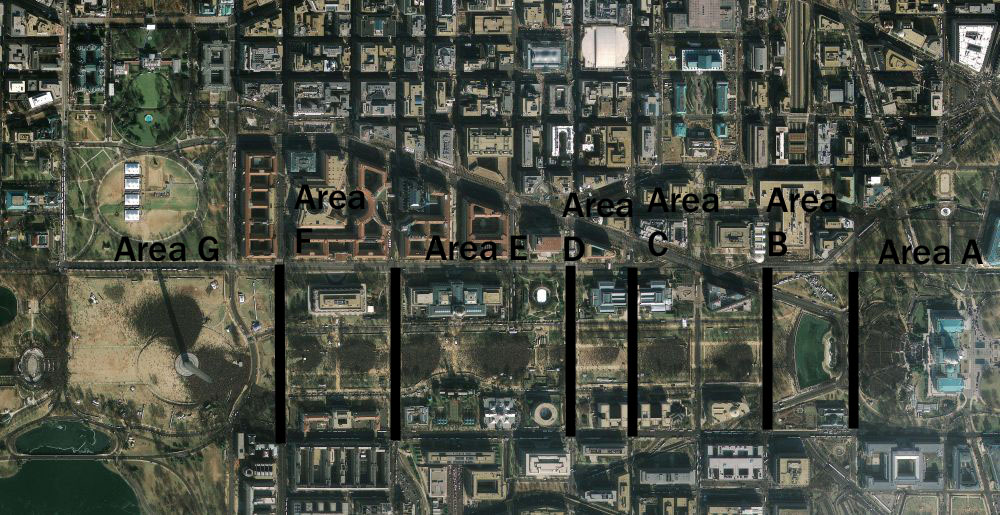
Edited picture featuring the different sections marked out for the problem
