POW #2 The More, the Merrier?
Write-Up
Problem Statement
The world, with its ever growing population, is in its highest growth percentage yet. The question is, which countries have the larger population growth in the world? In order to find the top ten countries with the highest population and compare their growth rate over the past decades, from 1960 to 2010, I need to find the data and graph it. Using this graph, I will be able to compare each of the countries to show which one has a higher or lower growth rate.
Process
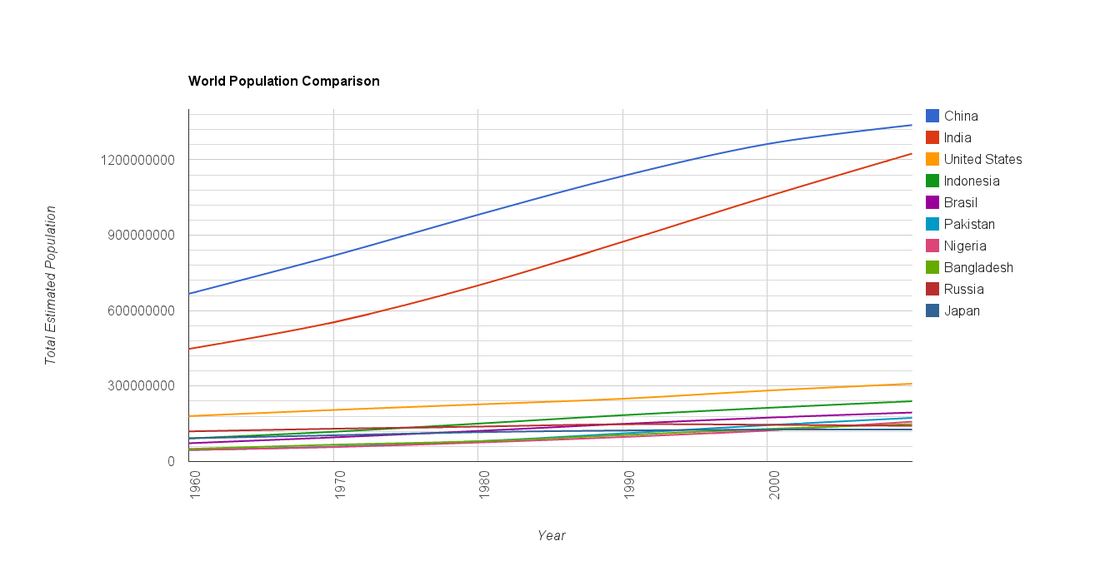
To start the project, I first needed to research some data about the ten countries with the highest population. I went online to www.google.com/publicdata, a site featuring a full list of census data. The search showed the top countries were, from greatest to least, China, India, United States, Indonesia, Brazil, Pakistan, Nigeria, Bangladesh, Russia, and Japan. Next, I created a graph to compare each of the countries. Looking at the graph, I see that China and India have the steepest increases out of all of the other countries. I use my calculator to find the average increase of population every year for the past fifty years. First, I take the Population of 2010 in China, which is 1,337,800,000 and subtract it by the total population of 1960, which is 667,070,000. Using the answer, I divide it by the number of years, which is 50, to get the final average. I perform the same process with the population statistics of India. China comes out with an average growth rate of 13,414,600 people every year while India has a growth rate of 15,535,116 people. This shows that India had the largest population growth rate from 1960 to 2010, although China has a larger population. Now, I need to find the lowest population growth rate. Looking at the 8 other countries’ populations, I do the same steps in order to compare their average yearly growth rate of each one. The averages come out with 2,573,560 for the United States, 2,958,486 for Indonesia, 2,443,754 for Brazil, 2,553,464 for Pakistan, 2,249,938 for Nigeria, 1,971,804 for Bangladesh, 440,460 for Russia, and 698,998 for Japan. By comparing all of these numbers, Russia is shown to have the smallest average growth rate over the 50 year period.
Solution
Out of the top ten most populated countries, India was shown to have had the highest average yearly population growth of 15,535,116 people while Russia had the lowest average yearly population growth of 440,460 people. India probably has the highest population growth because of its average number of children per family. Russia has the lowest population growth because of a dip in population around the year 2000.
Reflection
This Problem of the Week was not as challenging as I thought. While I was completing it, I used some familiar formulas such as averages and I graphed the numbers in a spreadsheet. I used a lot of evidence, which was the population data and statistics, in finding a solution.
Problem Statement
The world, with its ever growing population, is in its highest growth percentage yet. The question is, which countries have the larger population growth in the world? In order to find the top ten countries with the highest population and compare their growth rate over the past decades, from 1960 to 2010, I need to find the data and graph it. Using this graph, I will be able to compare each of the countries to show which one has a higher or lower growth rate.
Process
To start the project, I first needed to research some data about the ten countries with the highest population. I went online to www.google.com/publicdata, a site featuring a full list of census data. The search showed the top countries were, from greatest to least, China, India, United States, Indonesia, Brazil, Pakistan, Nigeria, Bangladesh, Russia, and Japan. Next, I created a graph to compare each of the countries. Looking at the graph, I see that China and India have the steepest increases out of all of the other countries. I use my calculator to find the average increase of population every year for the past fifty years. First, I take the Population of 2010 in China, which is 1,337,800,000 and subtract it by the total population of 1960, which is 667,070,000. Using the answer, I divide it by the number of years, which is 50, to get the final average. I perform the same process with the population statistics of India. China comes out with an average growth rate of 13,414,600 people every year while India has a growth rate of 15,535,116 people. This shows that India had the largest population growth rate from 1960 to 2010, although China has a larger population. Now, I need to find the lowest population growth rate. Looking at the 8 other countries’ populations, I do the same steps in order to compare their average yearly growth rate of each one. The averages come out with 2,573,560 for the United States, 2,958,486 for Indonesia, 2,443,754 for Brazil, 2,553,464 for Pakistan, 2,249,938 for Nigeria, 1,971,804 for Bangladesh, 440,460 for Russia, and 698,998 for Japan. By comparing all of these numbers, Russia is shown to have the smallest average growth rate over the 50 year period.
Solution
Out of the top ten most populated countries, India was shown to have had the highest average yearly population growth of 15,535,116 people while Russia had the lowest average yearly population growth of 440,460 people. India probably has the highest population growth because of its average number of children per family. Russia has the lowest population growth because of a dip in population around the year 2000.
Reflection
This Problem of the Week was not as challenging as I thought. While I was completing it, I used some familiar formulas such as averages and I graphed the numbers in a spreadsheet. I used a lot of evidence, which was the population data and statistics, in finding a solution.
Data
| pow_2_the_more_the_merrier_spreadsheet.xlsx |
